

2016年欧洲资产融资调查报告——欧洲租赁市场的表现
Leaseurope provides the best gauge of performance across the European leasing and automotive rental industry. The breadth of its influence as a platform can be seen in the fact that it has member associations in 33 countries, which include affiliates in Morocco and Tunisia.
欧洲租赁协会为欧洲租赁和汽车租赁业做了最佳的测评。从欧洲租赁协会影响的广度来看,他的会员遍布33个国家,其中包括来自摩洛哥和突尼斯的企业的子公司。
Leaseurope claims to represent some 1,400 leasing businesses and 500 short-term rental companies employing around 40,000 people, representing more than 90% of the European leasing market.
欧洲租赁协会代表1,400家租赁企业和500家短期租赁公司,40,000为雇员,这些数据能够代表90%以上的欧洲租赁市场。
Leaseurope Index
欧洲租赁指数
An important gauge of leasing performance in Europe is the quarterly Leaseurope Index. This tracks the performance of a group of major European lessors across seven key indicators, covering total portfolio and new business volumes (NBV) along with financial ratios concerning profitability, cost/income, cost of risk, return on assets (RoA) and return on equity (RoE).
每季度的欧洲租赁指数是说明租赁市场情况的重要指标。该指数通过7个关键指标追踪一大批欧洲主要租赁公司的经营状况,其中包括总投资组合、新增业务量(NBV)和包括成本收入比、风险成本、资产收益(RoA)和净资产收益(RoE)在内的财务比率。
Categories of assets leased include all types of machinery & equipment, cars and light commercial vehicles, trucks and heavy commercial vehicles, and real estate.
租赁资产类别包括所有类型的机械和设备、汽车、轻型商务车、卡车。重型商务车和房地产。
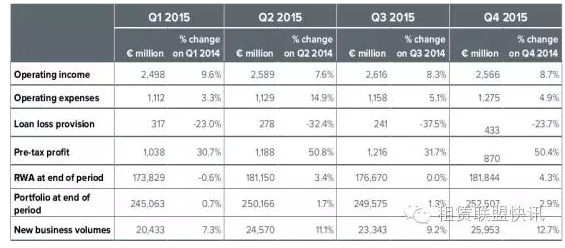
The Index for Q4 2015 shows an encouraging trend across all the performance indicators, with improvements in all quarters of 2015 compared to the same quarter the previous year.
2015年第四季度指数所有指标都显示出令人鼓舞的趋势,2015年各季度都比去年同季度有所提高。
Aggregate data, 2015
2015年数据表
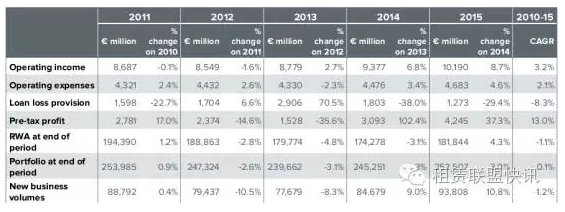
Looking at the data on an annual basis, all the indicators improved compared with 2014, indicating a much more positive trend overall for the industry after some lacklustre years. (It should be noted that the comparisons between 2013 and 2014 in the table below contain exceptional outliers regarding pre-tax profit and loan loss provision, due to a large loss provision in an isolated part of the sample in Q3 2013.)
年度数据显示,2015年所有指标与2014年相比都有提高,这表明,在多年低迷之后,行业整体趋势向好。(应该注意到,下表2013年与2014年的比较中,税前利润和风险准备金存在例外,因为2013年第三季度样本中大额风险准备金被独立出来)。
The compound annual growth rate (CAGR) gives average year-on-year growth rates and helps even out any unusual figures in specific periods. This measure shows progress generally in the right direction in all areas from 2010 to 2015.
复合年增长率(CAGR)给出了平均同比增长率,甚至帮助找出特定时期的任何异常的数据。这一方法显示2010年至2015年各领域的进展。
Operating income in 2015 amounted to €10.2 billion, an impressive increase of 8.7% on 2014. The five-year CAGR for operating income is also a satisfactory 3.2%.
2015年营业收入总计102亿欧元,较2014年上涨8.7%。5年营业收入CAGR为3.2%,同样可喜。
As mentioned, the large increases in aggregate profit figures for Q4 2015 and the full year 2015 are due mainly to loan loss provisions decreasing substantially from previously high levels, leading to further cheering CAGR totals of a 13% increase in pre-tax profit and an 8.3% fall in loan loss provision.
正如前面提到的,由于风险准备金大幅降低,2015年第四季度及2015全年总利润增长幅度大,导致税前利润CAGR进一步提高13%,风险准备金CAGR下降8.3%。
Meanwhile, NBV surged nearly 11% in 2015 to just under €94 billion which, despite following another strong uplift of 9% year-on-year in 2014, gives a five-year CAGR of only 1.2%. However, as elsewhere the trend is definitely upward and progress such as this is not so bad considering the economic ups and downs experienced globally and across Europe.
同时,2015年NBV飙升近11%,不到940亿欧元。尽管2014年同比上涨9%,涨幅也较大,但5年CAGR仅为1.2%。然而,和其他地方一样都是上涨趋势,但是考虑到全球和欧洲经济形势波动,取得这样的结果也并不糟糕。
Annual aggregate data, 2011-15
年度总数据,2011-15
The positive trend over time is revealed by the year-on-year growth rates in the following chart (excluding the extreme fluctuations in loan loss provision and pre-tax profit), headed by the steady rise in operating income and the more recent surge in NBV.
下图以营业收入和NBV(除了风险准备金和税前利润的极端波动)为首的同比增长率或是稳步增长或是大幅增长,显示了这段时间积极发展趋势。
Annual aggregate, change on previous year
年度总趋势 ,相比于上一年

The weighted average ratios for 2013 are distorted by the extreme outlier values already mentioned, but a comparison between 2014 and 2015 ratios shows some significant improvements.
前面提到,2013年平均加权比率受异常数据影响而失真,但是2014年和2015年比率的比较显示巨大进步。
The profitability ratio rose from 32% to nearer 42%, aided by the substantial reduction in aggregate loan loss provisions from previously high levels. This meant the average cost of risk declined from 0.7% in 2014 to 0.5% in 2015.
受风险准备金大幅降低的影响,盈利能力比率从32%上升至近42%。这意味着风险成本从2014年的0.7%降至2015年的0.5%。
There were strong improvements in the yearly RoA and RoE ratios, jumping from 1.3% to 1.7% and from 123 to 170, respectively.
年度RoA和RoE比率有明显提高,分别从1.3%跃至1.7%,从123增至170。
These positive growth trajectories indicate that conditions for lessors in 2015 were undoubtedly favourable compared with still hesitant economic growth, demonstrating the leasing industry’s resilient business model.
这种积极的发展轨迹表明,2015年租赁公司经营状况无疑好于目前起伏的经济增长,这表明租赁业是具有弹性的商业模式。
Weighted average ratios, 2015 vs 2014
平均加权比率,2015&2014

Good start to 2016
2016良好开局
The figures revealed in the Leaseurope Index for Q1 2016 are that key indicators remain strong.
欧洲租赁指标显示2016年第一季度关键指标仍然强劲。
NBV increased by 8.8% and total pre-tax profit of the participating companies saw double-digit growth of 12.7% compared with the same quarter a year earlier.
NBV同比上涨8.8%,参与调查公司的总税前利润呈两位数增长,较去年同期上涨12.7%。
The portfolio of outstanding contracts grew by 2.0% and risk-weighted assets increased by 3.0%.
未完成合同上涨2.0%,风险加权资产上涨3.0%.
Strong profitability and declining loan loss provisions contributed to the continuation of the positive trend in RoA and RoE indicators, at respectively 1.9% and 184.
强势的盈利能力和下降的风险准备金有利于RoA和RoE指数呈现持续的积极发展趋势,分别为1.9%和184。
However, operating income exhibited much slower growth in Q1 2016 compared to that seen in 2014 and 2015, while operating expenses increased at a greater rate. This makes the cost/income ratio the exception amongst otherwise improving weighted average ratios.
然而,2016年第一季度营业收入较2014年和2015年,增长缓慢,但是营业支出上涨比率较大。这影响了成本收入比率和异常数据,从而使平均加权比率上升。
The Leaseurope view is that the prospect of income growth slowing whilst costs escalate could be a cause for concern in the near future, although strong new business growth, as well as increasing portfolio levels, suggests that the leasing industry is well placed to meet any challenges that the rest of the year may bring.
欧洲租赁联盟认为,尽管新增业务量增长势头强劲,投资组合水平提高,但近期收益增长缓慢成本逐步攀升仍会引起警觉。这表明租赁业准备好了迎接今年剩下时间可能存在的任何挑战。
Aggregate data, Q1 changes
综合数据,第一季度变化

Comparison of Q1 weighted average ratios
第一季度平均加权比率比较

The industry view of prospects for 2016
2016年行业前景
The results of the latest half-yearly European Business Confidence Survey, conducted in December 2015 by Leaseurope and specialist international equipment leasing and asset finance consultancy Invigors EMEA, highlight an overall optimistic start to 2016 for European leasing.
欧洲商业信心调查是在2015年12月由欧洲租赁行业协会和国际设备租赁和资产融资咨询公司—Invigors EMEA共同进行的。调查结果显示2016年欧洲租赁业开局整体向好。
Providing forecasts for H1 2016, respondents expect growth to continue in a strong vein, and the balance of opinion on many other key indicators is generally favourable. These include:
调查对象预测2016年上半年增长前景存在持续强劲的迹象,对于其他关键指标的意见业非常积极。如下:
Nearly 45% of respondents are more optimistic about the prospects for their business during this period, while only 11% think their business prospects will worsen.
近45%的受访者对于2016年上半年业务前景持积极态度,而仅有11%的受访者认为业务前景堪忧。
85% of those surveyed expect new business volumes to increase, while just 5% anticipate a decline.
85%的受访者认为新增业务量会上升,5%的受访者认为下降。
65% of respondents anticipate that net profit in their organizations will increase over the period, with 18% forecasting a decline.
65%的受访者认为其公司净利润2016年上半年将增加,18%的受访者认为会下降。
However, 51% expect margins will decrease in their organizations, an increase on the previous survey, though a further 36% anticipate no change.
然而,51%的受访者认为其公司的利润会下降,而在之前的调查中他们认为利润会上升。36%的受访者认为利润不会变化。
One interesting trend is that over 50% of those surveyed now think that competition from new entrants is more likely in their home market, a perception that has increased steadily over recent surveys. Expectations of merger and acquisition activity remain at the level seen in the previous survey, with 41% of respondents predicting an increase in H1 2016 compared to 56% who anticipate no change.
还有一个有趣的趋势是超过50%的受访者认为与新市场参与者的竞争多来自国内市场,而持这种看法的人在最近一些调查中逐步增多。对于并购活动的预测与之前的调查一致,41%的受访者认为2016年上半年并购活动会增加,56%的受访者认为不会改变。
At the time of writing this report, towards the close of the first half of the year, the positive expectations had looked to be well founded. Meanwhile, there has been some encouraging economic data for GDP in the EU which shows growth has been near to 2% over the four quarters to Q1 2016 – not great, but showing steady improvement over the last four to five years. Unemployment across the EU has been gradually falling since it peaked in Q2 2013, and over the same period the trend in the number of employed persons has been upward.
这篇报告完成之时正好临近上半年结束,积极的预期得到印证。同时,欧盟GDP数据让人振奋,到2016年第一季度为止,四个季度的GDP增长近2%,虽然不高,但能保持4/5年的稳步增长。欧盟失业率在2013年第二季度问顶后逐渐下降,同时,就业人数有所上升。
However, the impact of the shock result of the referendum in the UK on 23 June to leave the EU will be far-reaching across financial markets.
然而,6月23日英国脱欧的公投结果的冲击,将对欧盟金融市场产生深远影响。
资料来源:怀特克拉克集团
翻译:中国租赁联盟、天津滨海融资租赁研究院 张 媛
编审:中国租赁联盟、天津滨海融资租赁研究院 季健霞
| 培训公告 | ||
| 8月26-27日 | 上海—金水湾大酒店 | 汽车融资租赁业务操作流程、模式创新与风险控制专题研讨会 |
| 欢迎垂询 133-3106-9587 杨志军 | ||
| 或登陆http://www.rzzlpx.com了解课程详情。 | ||
上一篇:租赁资产证券化融资政策与趋势
下一篇:租赁物的选择权与所属权
实务操作
- 融资租赁项目推荐
- 这一融资租赁案例入围上海金融法院十大执行典型案例
- 融资租赁“直转回”交易模式的法律分析
- 2026年租赁小微投放分析报告
- 金规25号文解读 | 厂商跨境融资租赁要高度警惕“杀猪盘”
- 金租新规25号文解读 | 严防融资租赁假借经营租赁逃避金融监管
- 干货!售后回租模式融资租赁合规要点解析
- 融资租赁租赁物未来发展趋势研究
- 人民法院报——融资租赁物适格性的审查标准
- 交银金租融资租赁纠纷案:典型争议与行业启示

政策法规
- 融资租赁进入3年“严打期”!
- 关于印发《陕西省制造业融资租赁财政贴息实施细则(2026年)》的通知
- 国务院重磅文件,支持融资租赁发展
- 国家金融监督管理总局有关司局负责人就《金融租赁公司融资租赁业务管理办法》答记者问
- 重磅!支持金租开展猪牛羊等活体租赁业务
- 财政部、中国人民银行、金融监管总局关于地方政府债务风险问题的整改情况(全文)
- 金租25号文重点条款解读
- 严禁低值高估,4.6万亿金融租赁行业监管再升级
- 重磅!严禁新增非设备类售后回租业务
- 天津市委金融办发文:做强融资租赁业务!